import pandas as pd
import matplotlib.pyplot as pltSubplots
data = pd.read_csv("data/salary.csv")data.head()| Age | All_Devs | Python | JavaScript | |
|---|---|---|---|---|
| 0 | 18 | 17784 | 20046 | 16446 |
| 1 | 19 | 16500 | 17100 | 16791 |
| 2 | 20 | 18012 | 20000 | 18942 |
| 3 | 21 | 20628 | 24744 | 21780 |
| 4 | 22 | 25206 | 30500 | 25704 |
ages = data["Age"]
dev_salaries = data["All_Devs"]
py_salaries = data["Python"]
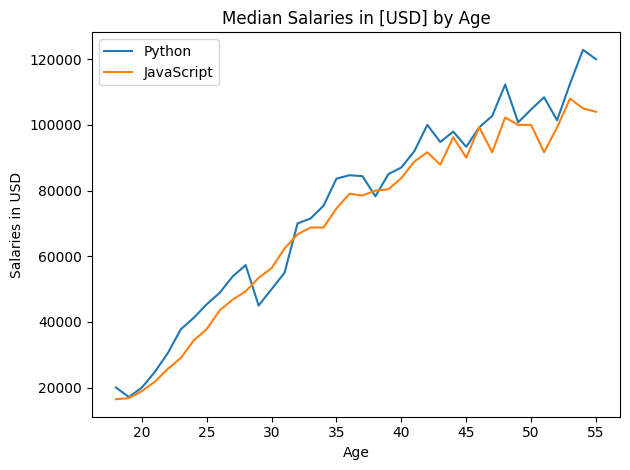
js_salaries = data["JavaScript"]plt.plot(ages, py_salaries, label = "Python")
plt.plot(ages, js_salaries, label = "JavaScript")
plt.plot(ages, dev_salaries, label = "All_Devs", linestyle = '--', color = "black")
plt.title("Median Salaries in [USD] by Age")
plt.xlabel("Age")
plt.ylabel("Salaries in USD")
plt.legend()
plt.tight_layout()
ages = data["Age"]
dev_salaries = data["All_Devs"]
py_salaries = data["Python"]
js_salaries = data["JavaScript"]
fig, ax = plt.subplots()
plt.plot(ages, py_salaries, label = "Python")
plt.plot(ages, js_salaries, label = "JavaScript")
plt.plot(ages, dev_salaries, label = "All_Devs", linestyle = '--', color = "black")
plt.title("Median Salaries in [USD] by Age")
plt.xlabel("Age")
plt.ylabel("Salaries in USD")
plt.legend()
plt.tight_layout()
# 적용 객체를 변경
ages = data["Age"]
dev_salaries = data["All_Devs"]
py_salaries = data["Python"]
js_salaries = data["JavaScript"]

fig, ax = plt.subplots()

ax.plot(ages, py_salaries, label = "Python")
ax.plot(ages, js_salaries, label = "JavaScript")
ax.plot(ages, dev_salaries, label = "All_Devs", linestyle = '--', color = "black")
ax.set_title("Median Salaries in [USD] by Age")
ax.set_xlabel("Age")
ax.set_ylabel("Salaries in USD")
ax.legend()
plt.tight_layout()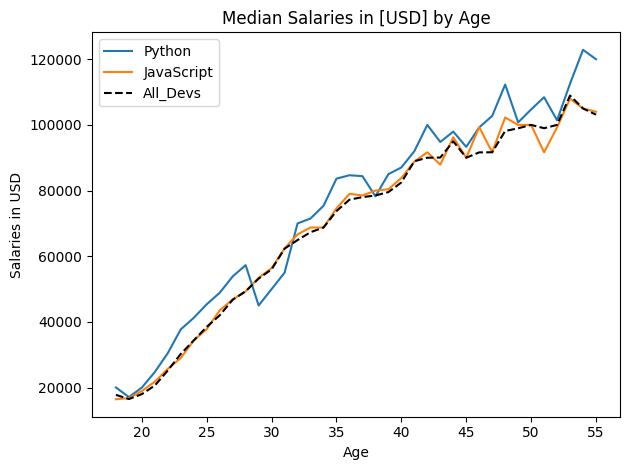
ages = data["Age"]
dev_salaries = data["All_Devs"]
py_salaries = data["Python"]
js_salaries = data["JavaScript"]

fig, (ax1, ax2) = plt.subplots(nrows = 2, ncols=1)

ax2.plot(ages, py_salaries, label = "Python")
ax2.plot(ages, js_salaries, label = "JavaScript")
ax1.plot(ages, dev_salaries, label = "All_Devs", linestyle = '--', color = "black")


ax1.set_title("Median Salaries in [USD] by Age")
ax1.set_xlabel("Age")
ax1.set_ylabel("Salaries in USD")
ax1.legend()

ax2.set_title("Median Salaries in [USD] by Age")
ax2.set_xlabel("Age")
ax2.set_ylabel("Salaries in USD")
ax2.legend()

plt.tight_layout()
# 제목 및 xlabel 공유
ages = data["Age"]
dev_salaries = data["All_Devs"]
py_salaries = data["Python"]
js_salaries = data["JavaScript"]

fig, (ax1, ax2) = plt.subplots(nrows = 2, ncols=1)

ax2.plot(ages, py_salaries, label = "Python")
ax2.plot(ages, js_salaries, label = "JavaScript")
ax1.plot(ages, dev_salaries, label = "All_Devs", linestyle = '--', color = "black")

ax1.set_title("Median Salaries in [USD] by Age")
ax1.set_ylabel("Salaries in USD")
ax1.legend()

ax2.set_xlabel("Age")
ax2.set_ylabel("Salaries in USD")
ax2.legend()

plt.tight_layout()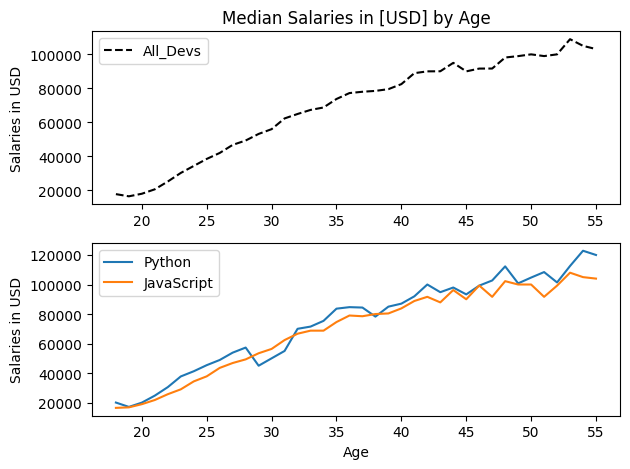
ages = data["Age"]
dev_salaries = data["All_Devs"]
py_salaries = data["Python"]
js_salaries = data["JavaScript"]

fig, (ax1, ax2) = plt.subplots(nrows = 2, ncols=1, sharex = True)

ax2.plot(ages, py_salaries, label = "Python")
ax2.plot(ages, js_salaries, label = "JavaScript")
ax1.plot(ages, dev_salaries, label = "All_Devs", linestyle = '--', color = "black")

ax1.set_title("Median Salaries in [USD] by Age")
ax1.set_ylabel("Salaries in USD")
ax1.legend()

ax2.set_xlabel("Age")
ax2.set_ylabel("Salaries in USD")
ax2.legend()

plt.tight_layout()
ages = data["Age"]
dev_salaries = data["All_Devs"]
py_salaries = data["Python"]
js_salaries = data["JavaScript"]

fig1, ax1 = plt.subplots()
fig2, ax2 = plt.subplots()

ax2.plot(ages, py_salaries, label = "Python")
ax2.plot(ages, js_salaries, label = "JavaScript")
ax1.plot(ages, dev_salaries, label = "All_Devs", linestyle = '--', color = "black")

ax1.set_title("Median Salaries in [USD] by Age")
ax1.set_xlabel("Age")
ax1.set_ylabel("Salaries in USD")
ax1.legend()

ax2.set_title("Median Salaries in [USD] by Age")
ax2.set_xlabel("Age")
ax2.set_ylabel("Salaries in USD")
ax2.legend()

plt.tight_layout()